US Dollar May Resume Slide as Yields Turn Lower on Strong Treasury Demand
US Dollar Index, DXY, Federal Reserve, US 10-Year Treasury Note, Quantitative Easing – Talking Points:
- Equity markets broadly gained during APAC trade as investors continued to cheer the prospect of additional fiscal support out of the US.
- Strong demand for 10-year notes at the Treasury’s monthly auction may cap the US Dollar’s upside.
- US Dollar Index (DXY) may slide lower as price continues to track within the confines of a Descending Channel.
Asia-Pacific Recap
Equity markets broadly gained during Asia-Pacific trade as investors cheered the prospect of expediated vaccine distribution and a more extensive fiscal stimulus package under a Joe Biden administration.
Australia’s ASX 200 index nudged 0.11% higher on the back of upbeat local employment figures, while Japan’s Nikkei 225 surged 1.04%. In FX markets, the haven-associated US Dollar lost ground against its major counterparts, while the cyclically-sensitive Norwegian Krone largely outperformed.
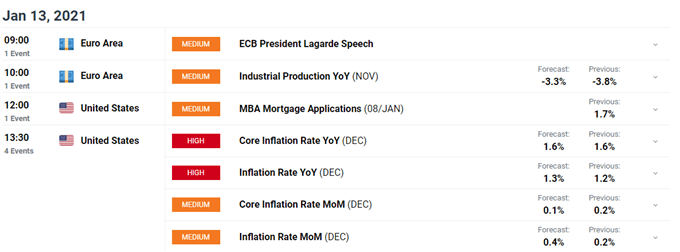
Gold prices crept 0.24% higher as yields on US 10-year Treasuries dipped back towards 1.10%. Looking ahead, US inflation figures for the month of December headline the economic docket alongside the Euro-area’s industrial production release for November.

Click here for full economic calendar
Strong Treasury Demand May Cap USD Upside
Robust demand for US 10-year notes at the Treasury’s monthly auction seems to have capped the significant move higher in yields seen in recent days, and may in turn halt the Greenback’s recent recovery against its major counterparts.
Bond prices have sold off substantially to kick-off 2021, as investors begin to price in a more extensive fiscal support package under a Joe Biden administration and react to comments from several members of the Federal Reserve that suggest the central bank is contemplating tapering its QE program.
However, it seems relatively unlikely that the Fed will reduce its bond purchasing program anytime soon, as the minutes from the FOMC’s December meeting stated that the central bank will continue to purchase at least $80 billion of Treasury securities and $40 billion of agency mortgage-backed securities per month “until substantial further progress has been made towards the Committee’s maximum employment and price stability goals”.


Recommended by Daniel Moss
Get Your Free USD Forecast
Indeed, Boston Fed President Eric Rosengren commented that he “expects it to be a little while before we’re even talking about tapering our purchases of government and mortgage-backed securities”. This statement reinforced the comments from Vice Chair Richard Clarida that his “economic outlook is consistent with us keeping the current pace of purchases throughout the remainder of the year [and] it could be quite some time before we would think about tapering the pace of our purchases”.
Therefore, with direct bidder participation in the Treasury’s recent $38 billion 10-year note auction rising to its highest levels since December 2019, and the Fed unlikely to adjust the rate of its bond purchases in the near term, a more extended push higher in yields seems relatively unlikely.
The absence of a more meaningful decline in bond prices may ultimately trigger the resumption of the US Dollar’s downtrend extending from the March 2020 highs.
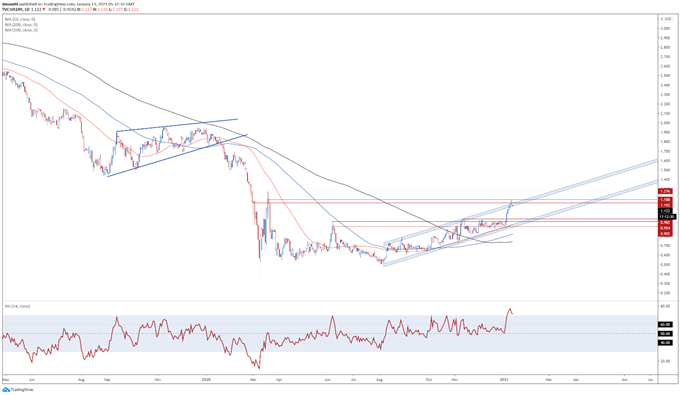
US 10-Year Treasury Yields Daily Chart – Channel Resistance Capping Upside

US 10-year Treasury yields daily chart created using Tradingview
From a technical perspective, US 10-year Treasury yields seem set to reverse lower in the coming days as a Shooting Star reversal candle forms at Ascending Channel resistance and the psychologically imposing 1.15 mark.
The development of the RSI hints that a downside push could be in the offing, as the oscillator eyes a move back below 70 and into normal territory.
A daily close back below 1.10 would probably trigger a pullback towards former resistance-turned-support at the November 11 high (0.98) and would likely coincide with further losses for the Greenback in the near term.
Alternatively, a convincing break above the January 12 high (1.18) could propel yields back towards the March 2020 high (1.28) and in turn lead to a more extended US Dollar recovery.
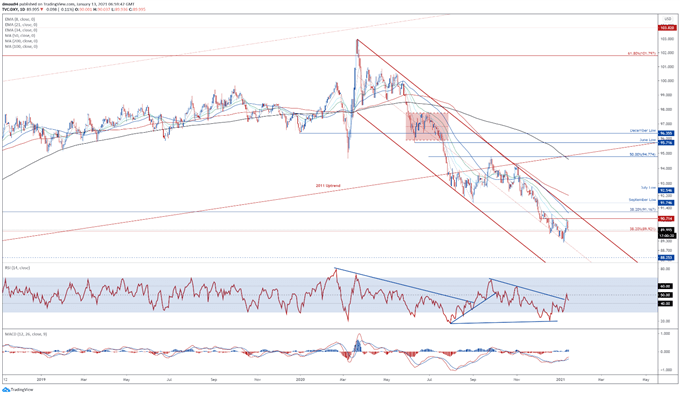
US Dollar Index (DXY) Daily Chart – 34-EMA Stifling Buying Pressure

DXY daily chart created using Tradingview
The US Dollar Index (DXY) seems poised to continue sliding lower in the near term, as price fails to hurdle the 34-day exponential moving average (90.55) and continues to track within the confines of a Descending Channel.
With the RSI and MACD indicator both tracking below their respective neutral midpoints, the path of least resistance seems skewed to the downside.
A daily close back below the 38.2% Fibonacci (89.92) could open the door for sellers to drive the index back towards the January low (89.21). A convincing break below that probably signalling the resumption of the primary uptrend and bringing the 2018 low (88.25) into play.
Alternatively, clambering back above the 21-EMA (90.20) could neutralize near-term selling pressure and propel the DXY back towards the monthly high (90.73).
-- Written by Daniel Moss, Analyst for DailyFX
Follow me on Twitter @DanielGMoss


Recommended by Daniel Moss
Improve your trading with IG Client Sentiment Data

January 13, 2021 at 08:30PM
Daniel Moss
https://www.dailyfx.com/forex/fundamental/daily_briefing/session_briefing/euro_open/2021/01/13/US-Dollar-May-Resume-Slide-as-Yields-Turn-Lower-on-Strong-Treasury-Demand.html
Labels: Forex Market Outlook

0 Comments:
Post a Comment
Subscribe to Post Comments [Atom]
<< Home