Australian Dollar Outlook: AUD/USD Eyes Trade Data - Rebound or Breakdown?
Treasury Yield Curve, Australia Balance of Trade, AUD/USD – Talking Points
- Wall Street rally cools but energy sector strength bolsters small-cap stocks
- US fiscal stimulus developments push Treasury yield curve to highest level since 2015
- AUD/USD subject to movement ahead of Australia’s balance of trade data


Recommended by Thomas Westwater
Get Your Free Top Trading Opportunities Forecast
Wall Street moved higher for a third consecutive day on Wednesday as traders focused on the economic recovery following upbeat economic data. Upside momentum seen earlier in the week ebbed, however, as technology stocks moved lower despite better-than-expected earnings from Alphabet and Amazon after yesterday’s closing bell. The Nasdaq Composite cut early gains going into the close and put in a 0.01% loss.
Still, the S&P 500 and Dow Jones Industrial Average managed to record gains of 0.10% and 0.12%, respectively. Robust strength in the energy sector boosted the small-cap Russell 2000 index 0.38% higher. WTI crude oil hit a fresh-yearly high after the Energy Information Administration reported a weekly inventory draw of 994k barrels for the week ending January 29.
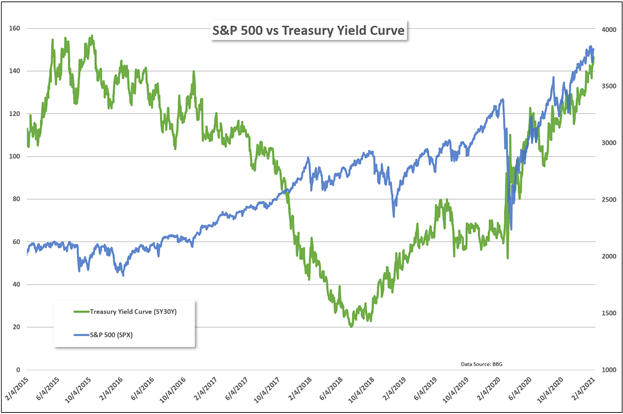
The spread between 5-year and 30-year Treasury yields moved higher after President Joe Biden told Democratic lawmakers that he will not concede to GOP demands for smaller stimulus payments. Although Mr. Biden did indicate that he is open to narrowing the eligibility requirements. Moreover, Democrats on Capitol Hill continued to push ahead with plans to pass the $1.9 trillion stimulus package without Republican support. The 5Y30Y yield curve steepened to its highest level since late 2015 as markets betted on developments translating to increased inflation prospects.
S&P 500 vs 5Y30Y Treasury Yield Curve

Thursday’s Asia-Pacific Outlook
Asia-Pacific markets appear set to trade with the same lackluster enthusiasm seen on Wall Street after a strong start to the week. Japan’s Nikkei 225 rose 1.00% on Wednesday. Elsewhere, Hong Kong’s Hang Seng Index (HSI) managed to close 0.20% higher, while mainland China’s Shanghai Composite Index fell by 0.5%.
Australia’s balance of trade data for December is set to cross the wires at 00:30 GMT, according to the DailyFX Economic Calendar. Traders will be keying in on the nation’s exports to China – particularly iron ore – as tensions between Australia and its biggest trading partner continue to deepen. The Australian Dollar’s recent weakness appears to have cooled despite the RBA extending its bond-buying program earlier this week.
AUD/USD Technical Forecast
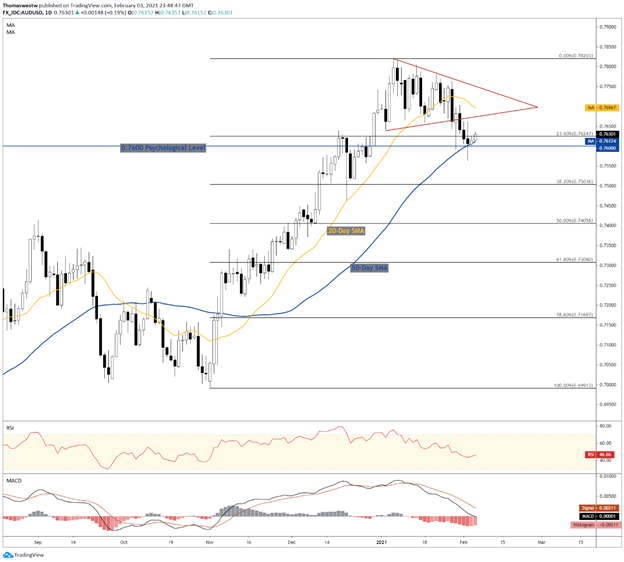
AUD/USD found support near the psychologically important 0.76 handle after the cross broke down from a Symmetrical Triangle last week. The 50-day Simple Moving Average (SMA) also appears to be providing a level of support. However, the MACD line is making a cross below its zero line, which indicates a bearish signal and potential for further downside.
AUD/USD Daily Chart

Chart created with TradingView


Recommended by Thomas Westwater
Improve your trading with IG Client Sentiment Data
AUD/USD TRADING RESOURCES
--- Written by Thomas Westwater, Analyst for DailyFX.com
To contact Thomas, use the comments section below or @FxWestwateron Twitter

February 04, 2021 at 12:00PM
Thomas Westwater
https://www.dailyfx.com/forex/fundamental/daily_briefing/daily_pieces/asia_am_briefing/2021/02/04/Australian-Dollar-Outlook-AUDUSD-Eyes-Trade-Data-Rebound-or-Breakdown.html
Labels: Forex Market Outlook

0 Comments:
Post a Comment
Subscribe to Post Comments [Atom]
<< Home