GBPUSD breaks back below the 38.2% retracement on the hourly chart. Extends the narrow trading range
Back down testing its 100 hour moving average
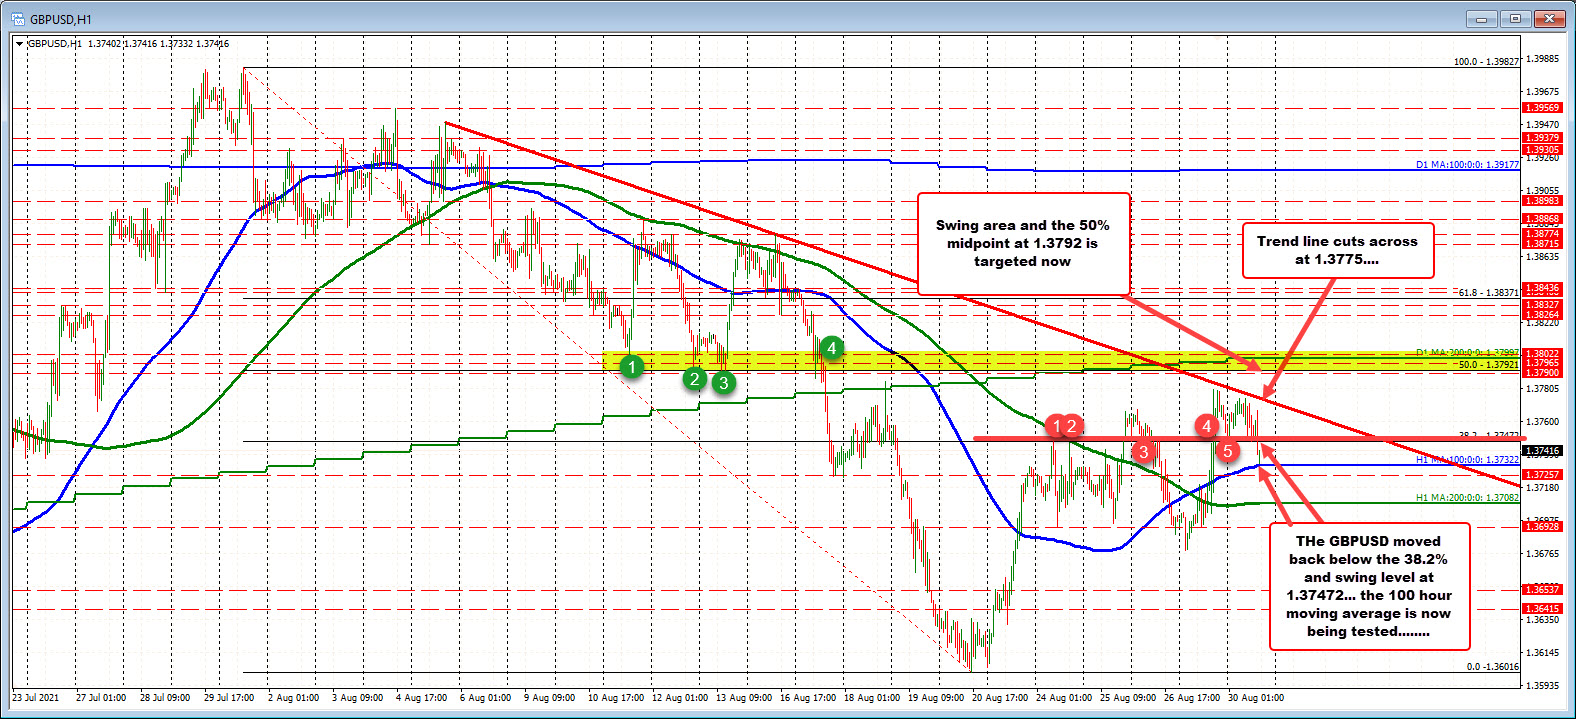
The GBPUSD just extended the trading range for the day and in the process moved back below its 38.2% retracement of the move down from the July 30 high.
That level comes in at 1.37472. The European session low stalled right around that level and moved up into the early New York trading, but the price has just reversed lower and extends down to the 100 hour moving average (blue line in the chart below).

The range today's was only 29 pips a few minutes ago, but has extended to 41 pips with the recent move to the downside.
It is a UK holiday which limits trading activity. Nevertheless breaking the support at the 38.2% retracement gives the sellers a little more of a intraday edge at least in the short term. Having said that, there is still more work to do if the sellers are to take even more control today.
Getting below the 100 hour moving average (blue line at 1.37322) followed by the 200 hour moving average (at 1.37082 green line), are the next steps for additional bearish momentum.
Conversely, hold the 100 hour moving average and get back above the 38.2% retracement at 1.37472 would disappoint the sellers from the break lower.
On a move back higher (and back above the 38.2% retracement), the next target level comes in against a downward sloping trendline which cuts across currently at 1.3775. Above that is the 50% retracement 1.37921 and a swing area between 1.3790 and 1.3802. The 200 day moving average is also within that area at 1.37998 (see yellow area in the chart above). Needless to say, getting back above all those levels is really what needs to be done if the buyers are to take more control away from the sellers.
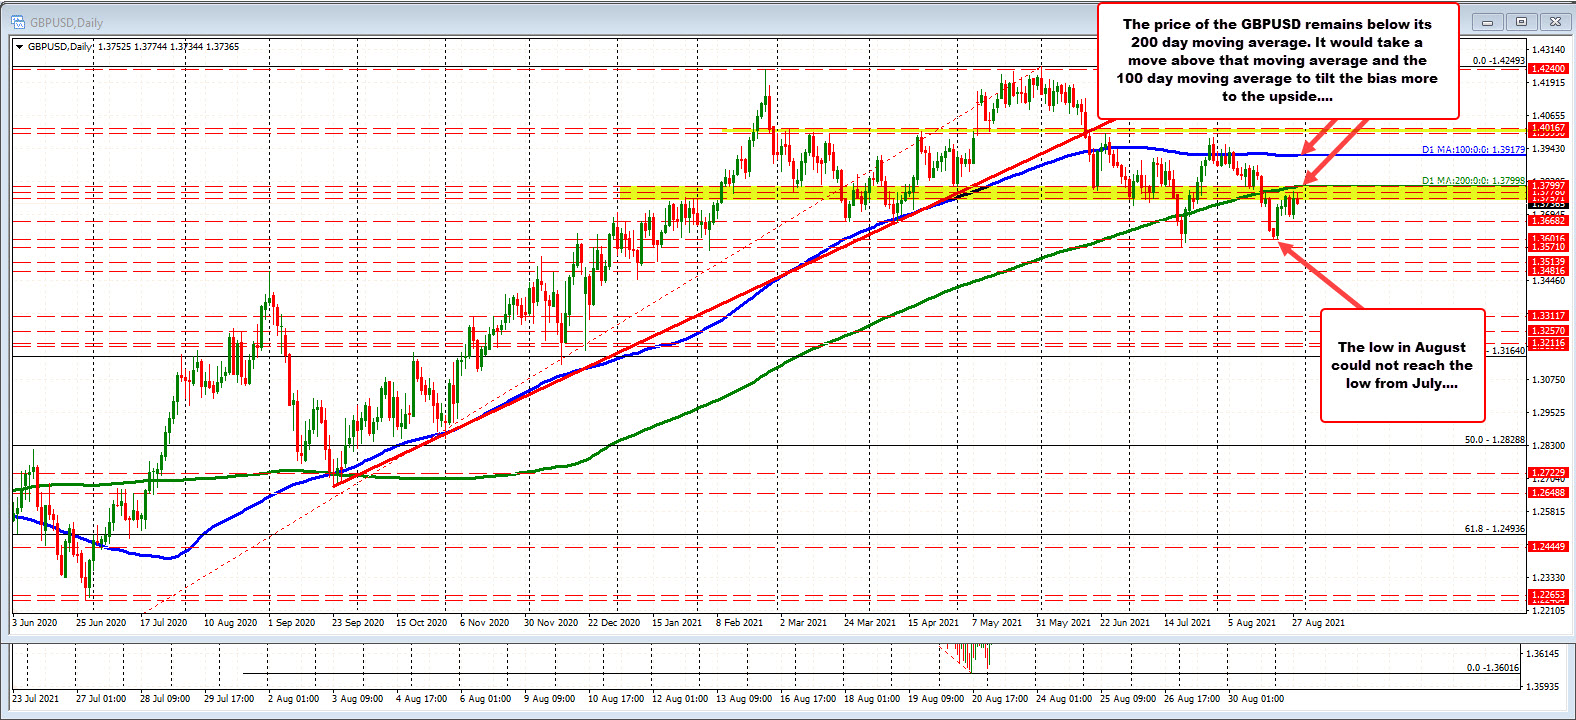
Taking a broader look at the daily chart below, as mentioned above, the price for the GBPUSD still remains below the 200 day moving average (green line in the chart below). The 100 day moving average is also higher 1.39179 (blue line in the chart below). The low for the month of August stalled ahead of the low for the year from July (at 1.3571). The August low reached 1.36016 before rebounding.
Ultimately the 200 day moving average will be a key barometer for the pair in the short term and as we head toward the end of the year. If the price can not extend back above the 200 day moving average, there is a good chance traders take out the lows for the year and extend the trading range. Conversely get back above the 200 day moving average and it opens the door for further upside potential.

Invest in yourself. See our forex education hub.

August 31, 2021 at 01:12AM
Greg Michalowski
https://ift.tt/3DuYzBG

0 Comments:
Post a Comment
Subscribe to Post Comments [Atom]
<< Home