USDJPY trades above and below its 100 bar moving averages
100 hour MA at 109.587. 100 day MA at 109.639
The USDJPY has been trading above and below its 100 bar moving averages over the last six trading hours after declining on a failed break of the higher 200 hour MA (green line in the chart below).
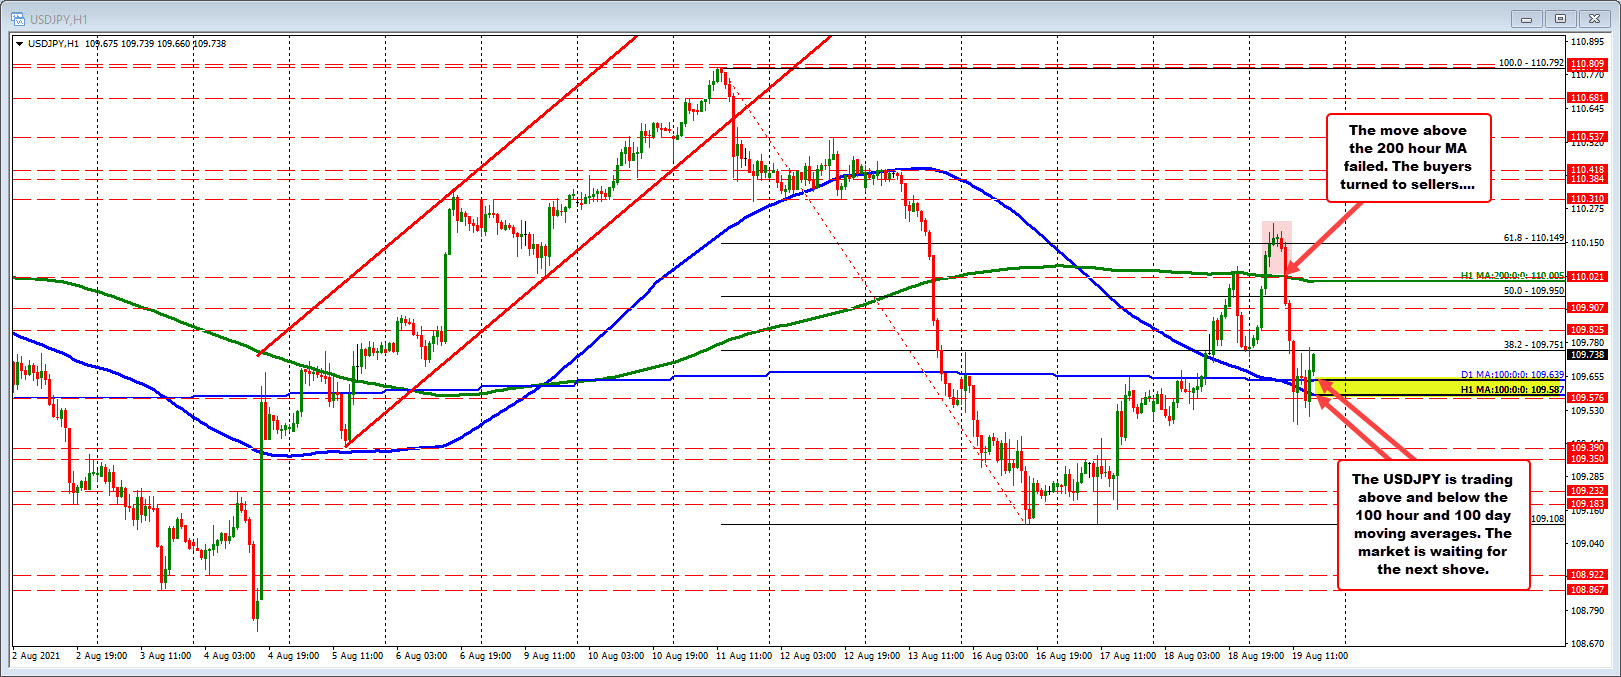
The USDJPY moved up to test its 200 hour moving average just ahead of the FOMC meeting minutes, but initially fell on the headlines. The price moved down toward the 100 hour moving average but found early buyers near the close.
The Asian session saw a rebound higher with the USDJPY price living above its 200 hour moving average (and also above the 110.00 level in the process.
However as stock started to come off, so do the USDJPY. The failed break above the 200 hour moving average also contributed to the declines.
The London morning session saw the pair move back below its 100 day moving average (blue line at 109.639) and 100 hour moving average (lower blue line at 109.587). The low price reached 109.477, but as seen choppy price action between that low and 109.76 over the last six trading hours. The price is waffling above and below the MA levels.
The better claims data push the price back above the moving averages. Stocks in premarket trading remain lower but off the levels at the start of the New York session. The 10 year yield is up about 1.2 basis point from the early New York levels as well but still remains down on the day by -3.5 basis points at 1.238%. Trends/movements in those instruments today will likely either help or hurt the USDJPY.
August 20, 2021 at 01:11AM
Greg Michalowski
https://ift.tt/2UA58Bo

0 Comments:
Post a Comment
Subscribe to Post Comments [Atom]
<< Home