USDJPY tests intraday support near moving average levels
The ups and downs can continue for the pair. Dollar higher today pushes the USDJPY higher
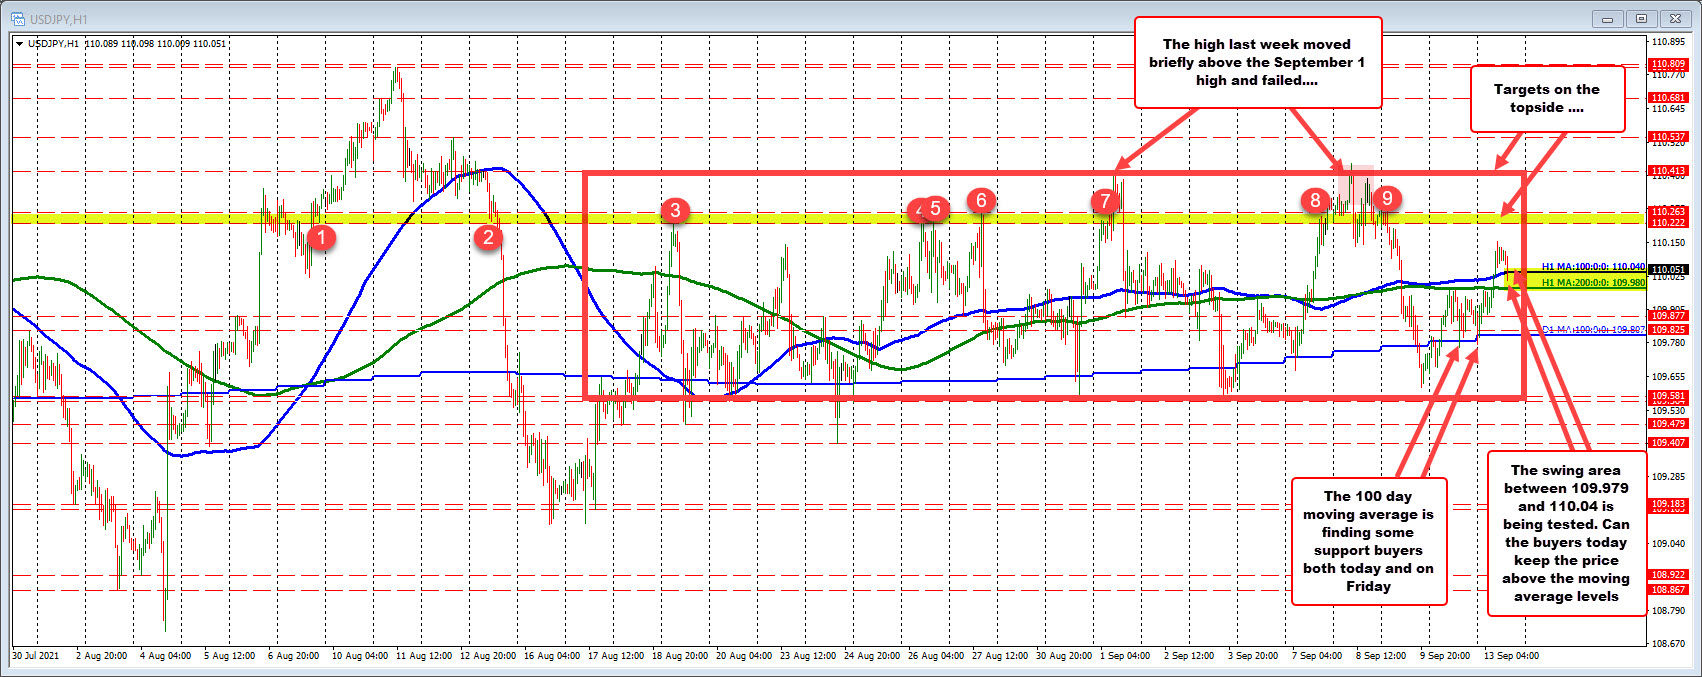
The USDJPY has been mired in a up and down trading range. The low price cents August 17 comes in at 109.407. The high price extended to 110.442 on Wednesday last week. That high price did extend above the September 1 high at 110.413, but only briefly and the price has rotated back down.
There is interim support within that range near the 109.56 – 109.58 area. The rotation back to the downside from Wednesday's high saw the price stall ahead of that area. The low on Friday reached 109.615 (just above the area) green and bounced.
The bounce on Friday saw the price move back toward the near converged 200 and 100 hour moving averages (blue and blue lines), but found sellers near that area. The rotation back down on Friday found buyers near its 100 day moving average (currently at 109.807).
In trading today, the early Asian trading saw the price stall against that aforementioned 100 day moving average near 109.807. The price moved to the upside with the overall dollar buying today. That pushed the pair above its 200 and 100 hour moving averages currently at 109.979 and 110.041 respectively. The high price reached 110.154.
What now?.
There has been an early dip in the North American session that has taken the price back between the two hourly moving averages. The question for traders now is "can those moving averages stall the corrective intraday fall, and lead to a rotation back to the upside?".
If support can hold against the moving averages, the 110.222 to 110.263 becomes the next upside target followed by the highs over the last few weeks near 110.413 and 110.442. Of course getting above that ceiling area would be a step in the bullish direction and take the price outside of the "red box".
Conversely a move back below the moving averages, would tilt the bias more in the downside direction with support near the 100 day moving average at 109.807 as the next target.
Let's face it, the USDJPY pair has been in a up and down trading range. Such a dynamic leads to swings from one extreme to the other. In between sits the 100 and 200 hour moving averages which helped to tilt the bias either in the bullish or bearish direction. Right now, the tilt on the rally today has the buyers with a touch more control. However, the price needs to stay above those moving averages, to keep the control.

September 14, 2021 at 01:15AM
https://ift.tt/2Xcx5Rb

0 Comments:
Post a Comment
Subscribe to Post Comments [Atom]
<< Home