USDJPY bounces off its 100 hour moving average
The October 2018 high at 114.544 in the USDJPY is the next key target
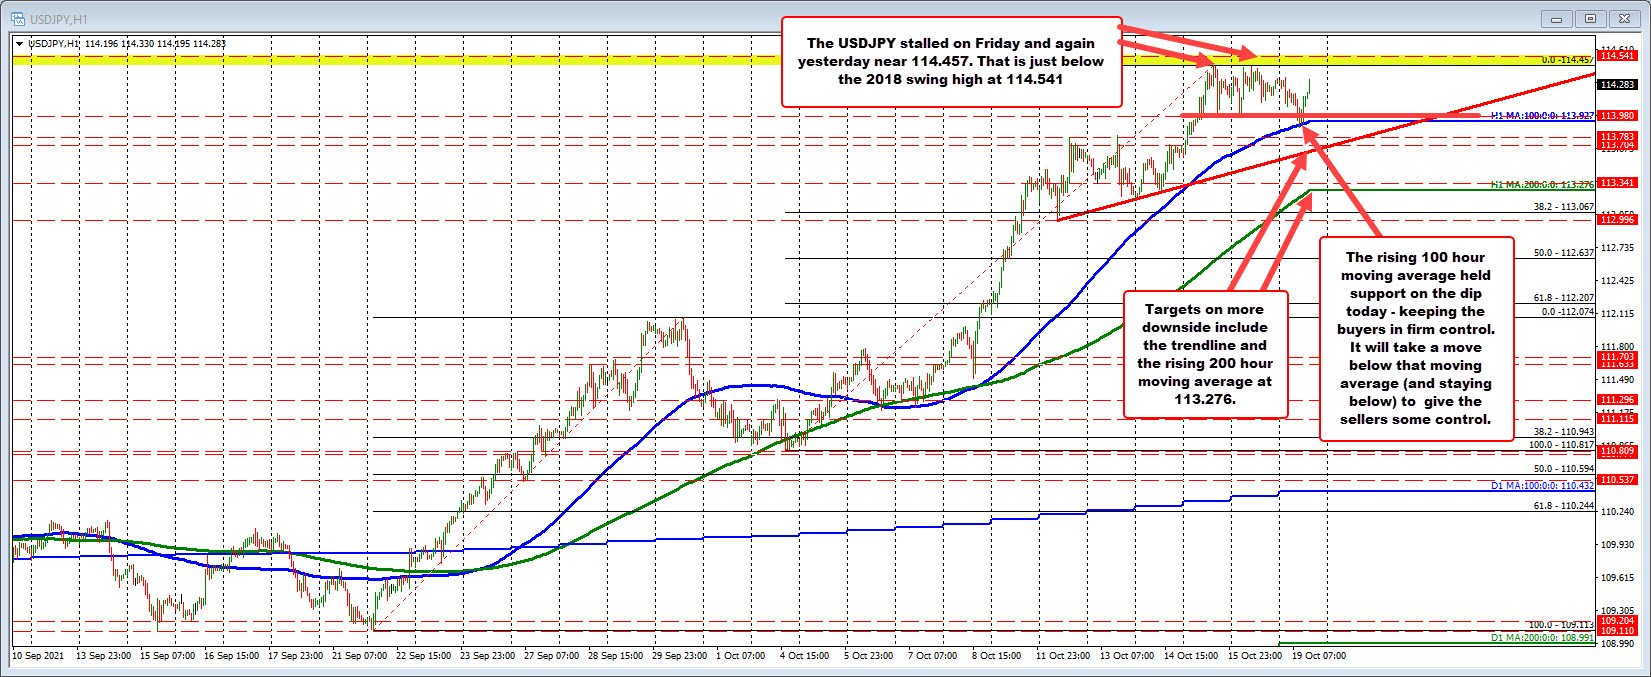
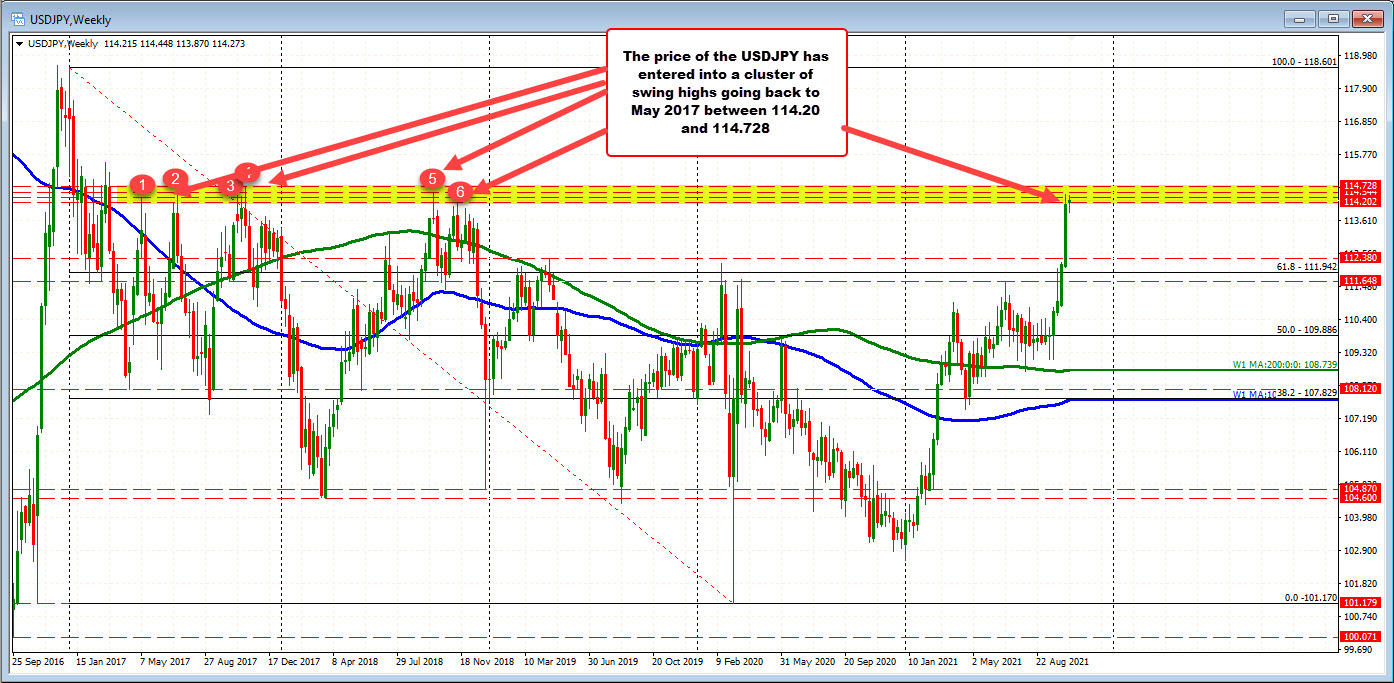
The USDJPY has been consolidating in a up and down trading range over the last three trading days after reaching a high for the year (and highest level since October 2018) at 114.457 on Friday. Yesterday's high price stalled just below that level at 114.448. Both those highs stalled just ahead of the October 2018 swing high price of 114.541. A move above that level would take the price to the highest level since October 2017 where the high price stalled at 114.728.

The price of the USDJPY currently trades within a cluster of swing highs going back to May 2017 between 114.20 and 114.728 (see weekly chart below). The current price is trading at 114.30.
In the buyers favor technically, is that the dip into the European session today found buyers near its rising 100 hour moving average currently at 113.927 (blue line in the chart above). The last time the price closed an hourly bar BELOW its 100 hour moving average was back on October 5.
That 100 hour moving average continues to move higher and will remain a key barometer for buyers and sellers going forward. Stay above is more bullish. Move below is more bearish. On a dip below, there are swing highs from last week between 113.70 and 113.783, along with the rising trendline which cuts across at 113.65. The rising 200 hour moving averages currently at 113.296. That would also be a downside target that sellers would need to move below if they are to take more control.


October 20, 2021 at 01:02AM
https://ift.tt/2ZcSytU

0 Comments:
Post a Comment
Subscribe to Post Comments [Atom]
<< Home