GBPUSD trades back above and below the 100 hour MA in trading today, but buyers can't keep the momentum going
Back below the 100 hour MA at 1.33388.
The GBPUSD moved to the lowest level for the year and the lowest level since December 21, 2020 on Friday. In the process the pair targeted and tested a lower trend line connecting July and September lows. That trend line cut across at 1.3280. The low price reached 1.3277 just below that level.

Drilling to the hourly chart below, the subsequent rise off the low on Friday has been modest relatively. The high price on Friday did extend above its 100 hour moving average (blue line) - closing near that moving average level on Friday.
In trading today the pair open below the 100 hour moving average and stayed below through the Asian session. In the European session, there has been a spike back above the level, reaching the highest level since last Wednesday at 1.33623. However, buying dried up well ahead of the higher 200 hour moving average (green line) currently at 1.33950.
The subsequent move back to the downside has now seen the price fall back below its 100 hour moving average 1.33388. The current price trades around 1.3330. The low for the day reach 1.33184.
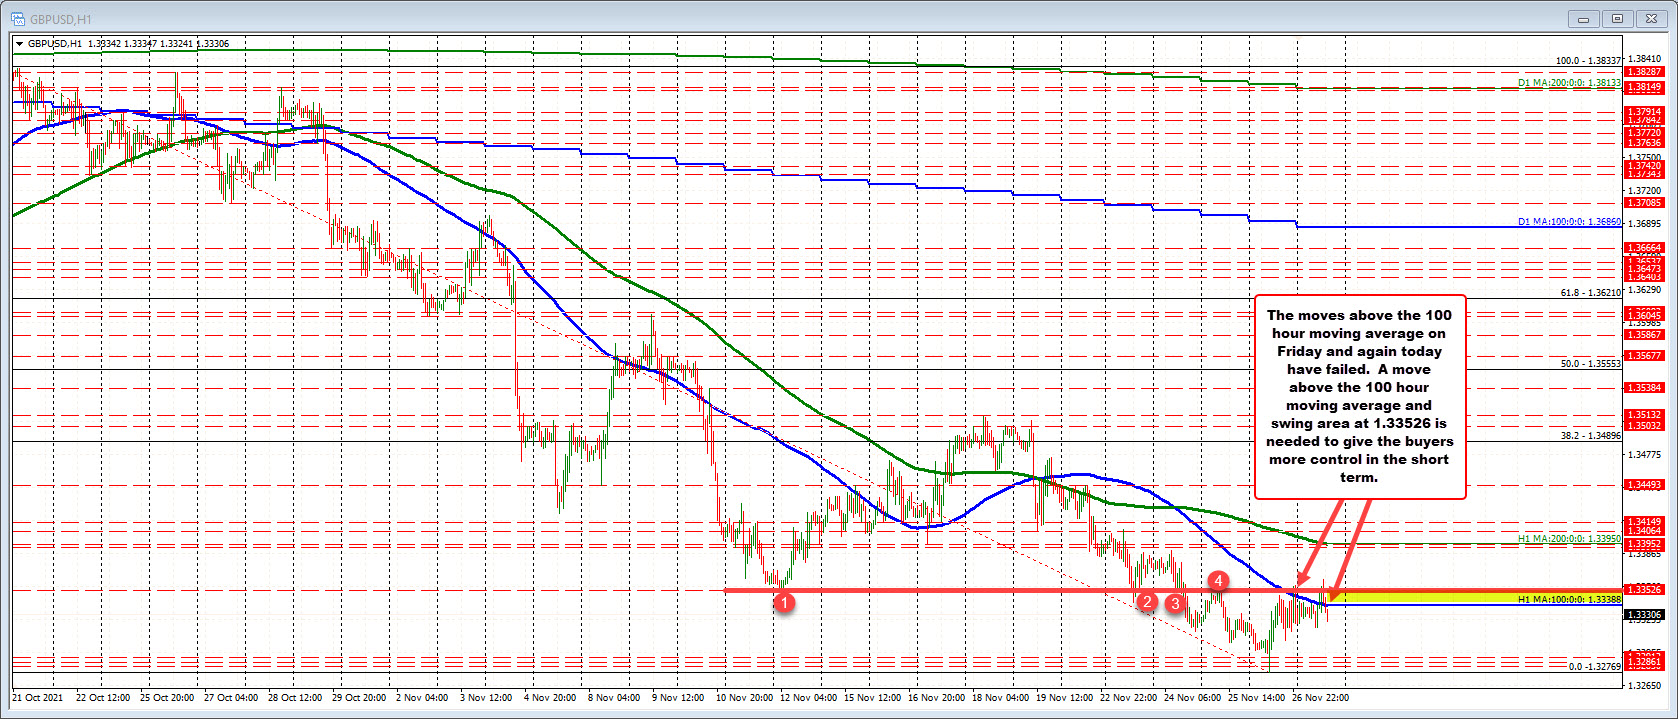
The ups and downs above and below the 100 hour moving average (blue line) suggests traders are not fully on board with a run higher. Just above the 100 hour moving average is a swing level near 1.33526. The 200 hour moving average at 1.3395 is still a long ways away and was obviously not closely tested at the highs today.
If the buyers are to take more control, getting back above the 100 hour moving average and the swing area 1.33526 is the first hurdle. The 200 hour moving average would also be a minimum target if the buyers are to start "winning" again.
Absent that, and the buyers are simply are not taking control (or "winning"). Intraday, watching the 100 hour moving average now is potential resistance. The lower trend line from the daily chart remains a key target on the downside that would need to be broken to increase the bearish bias.
November 30, 2021 at 01:55AM
Greg Michalowski
https://ift.tt/3cVZ8bL

0 Comments:
Post a Comment
Subscribe to Post Comments [Atom]
<< Home