GBPUSD bounces off 200 day MA
200 day MA tested for the first time since September 2020
The GBPUSD has moved down to test the 200 day MA at 1.36906 (bid side). That moving average has not been breached that since September 2020, and has not closed below that moving average since July 2020. The pair is also testing the swing lows from March and April near 1.36682 to 1.3673.
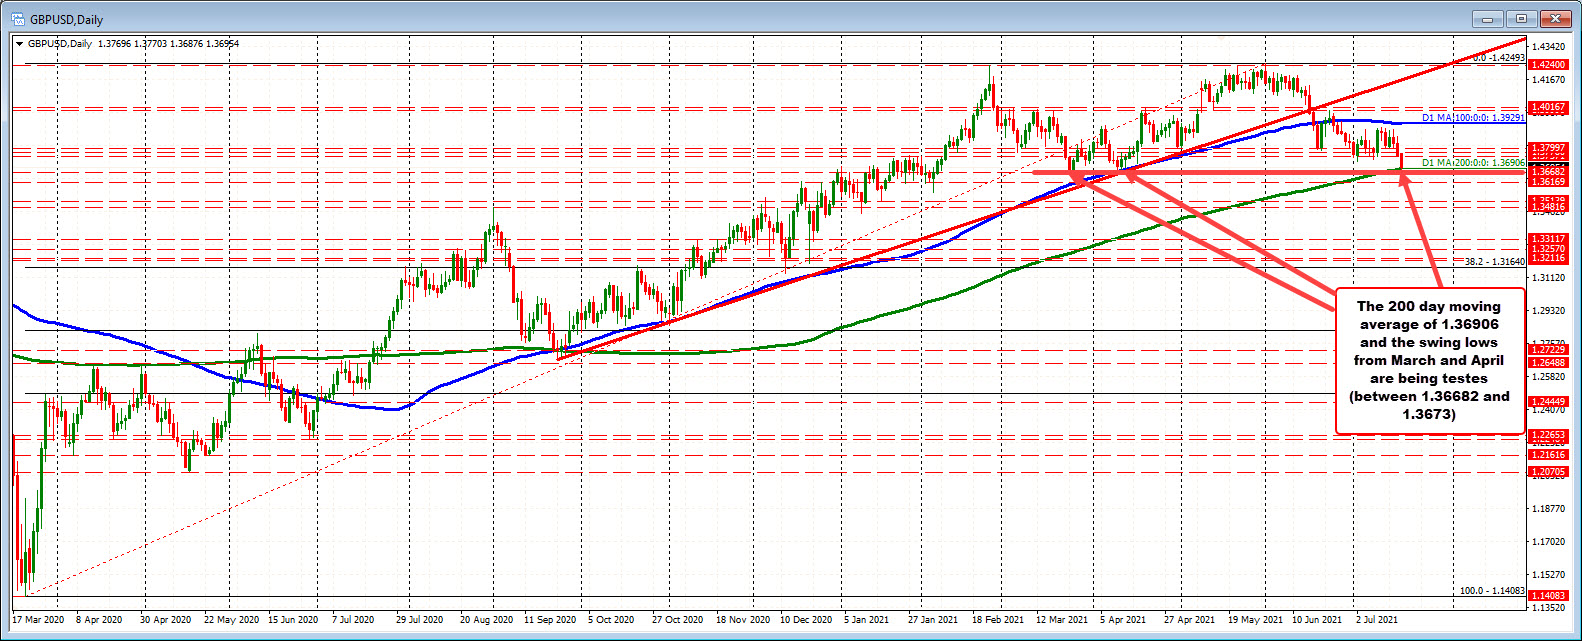
The low just reached 1.36876. That took the price below the 200 day moving average, but not below the swing lows from March and April just yet. A move and close below those levels would increase the bearish bias from a technical perspective.
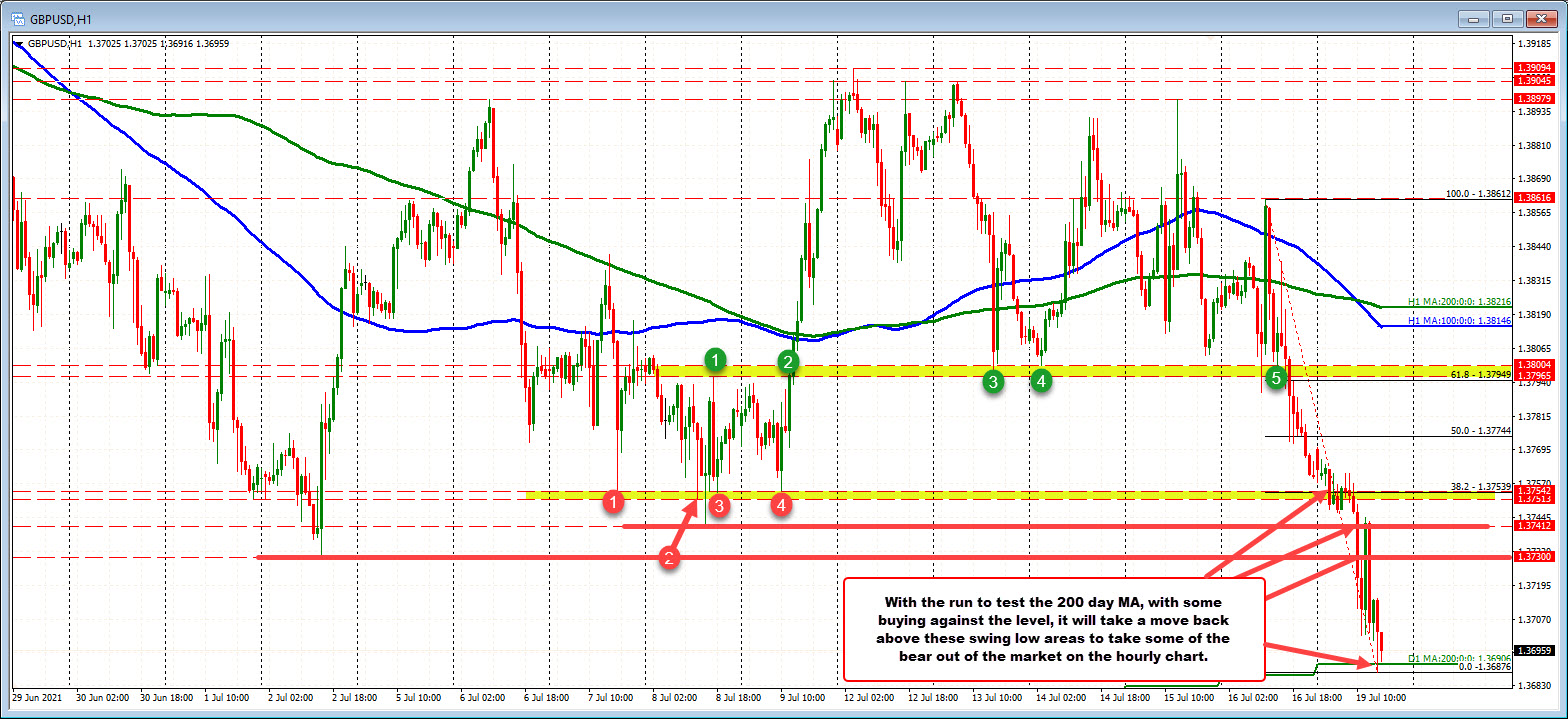
Drilling down to the hourly chart below, the price broke lower on Friday and in the process moved below a swing area at around the 1.3800 area (see green numbered circles).
Today, the price fell below a swing area from July 7 and July 9 between 1.3751 to 1.3754 (see red numbered circles). Bearish.
The swing low from July 8 at 1.37412 and July 2 at 1.3730 are also levels that increased the bearish bias.
If the buyers off the 200 day moving average (modest so far) are to get more serious about their intentions, getting above 1.3730, the 1.3741 and 1.3754 (also the 38.2% of the move down from the high on Friday) would be needed to increase the buyers bias (and give the buyers some additional confidence). Failure to do that and the sellers remain in the driver's seat.
July 20, 2021 at 01:21AM
Greg Michalowski
https://ift.tt/3risnvJ

0 Comments:
Post a Comment
Subscribe to Post Comments [Atom]
<< Home