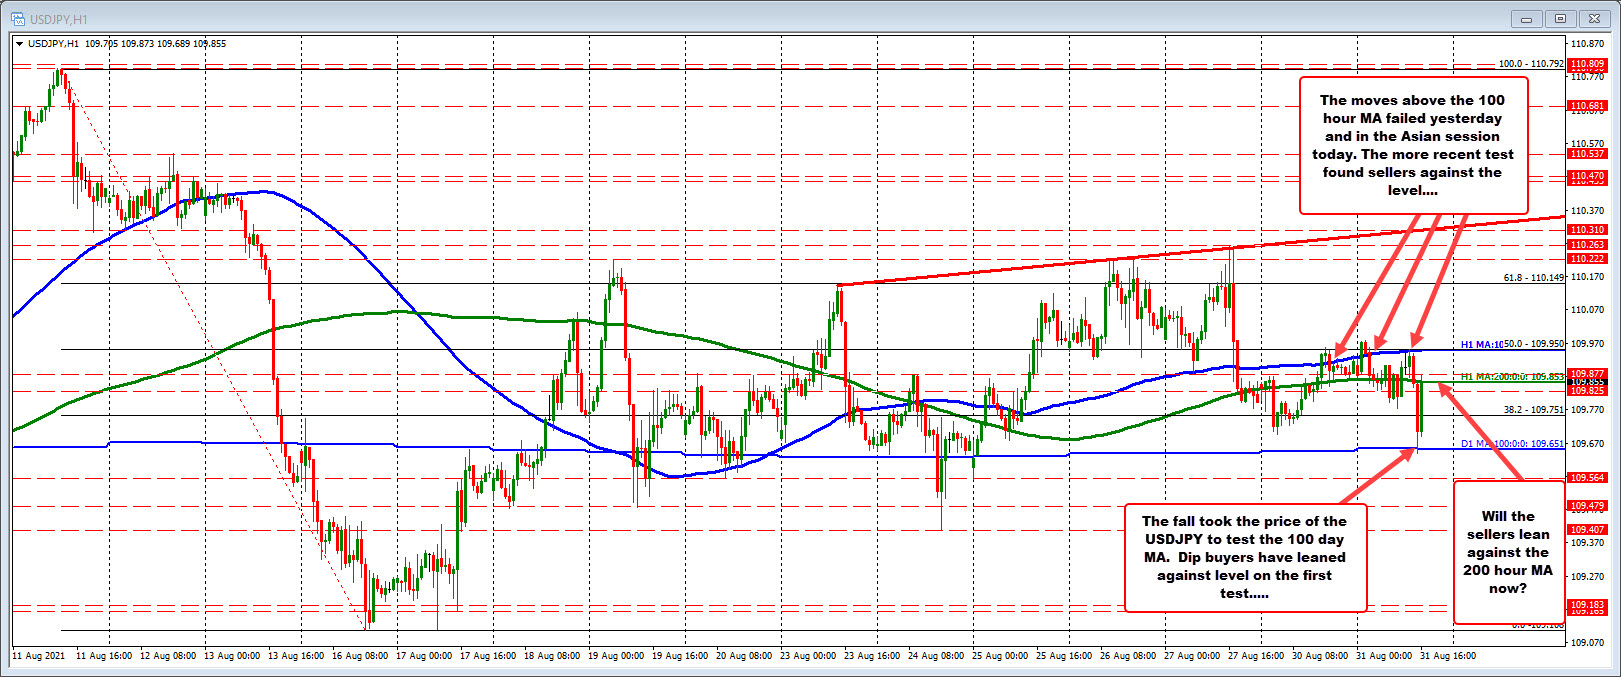
USDJPY falls to test the 100 day MA. Dip buyers lean against the key MA level
It is month end..

The move back to the upside has reached the 200 hour moving average at 109.853 (green line in the chart above). The question now for traders is "Can the sellers keep the rebound in check against that 200 hour moving average level?".
Earlier in the Asian session, the buyers were able to push above its 100 hour moving average and 50% retracement near the 109.93 to 109.95 area. The price reached 109.977 before rotating back to the downside.
The London morning session high price moved back toward that 50% level and 100 hour moving average at 109.95, but could not extend above. That led to the downside move. Ultimately, if the price is to move higher not only getting above the 200 hour MA will be eyed, but also getting above the 50%/100 hour moving average would be required.
For now however, it seems the 200 hour moving average above, and the 100 day moving average below will be the resistance and support, with traders looking for the next shove one direction or the other.
****Remember today is the last trading day of the month of August. That could influence flows higher or lower depending upon supply and demand conditions within the market. As a result, we can see some quick moves down and quick moves up as well.

September 01, 2021 at 01:14AM
Greg Michalowski
https://ift.tt/2UZS8oI

0 Comments:
Post a Comment
Subscribe to Post Comments [Atom]
<< Home