GBPUSD retraces some of the declines seen in the European session
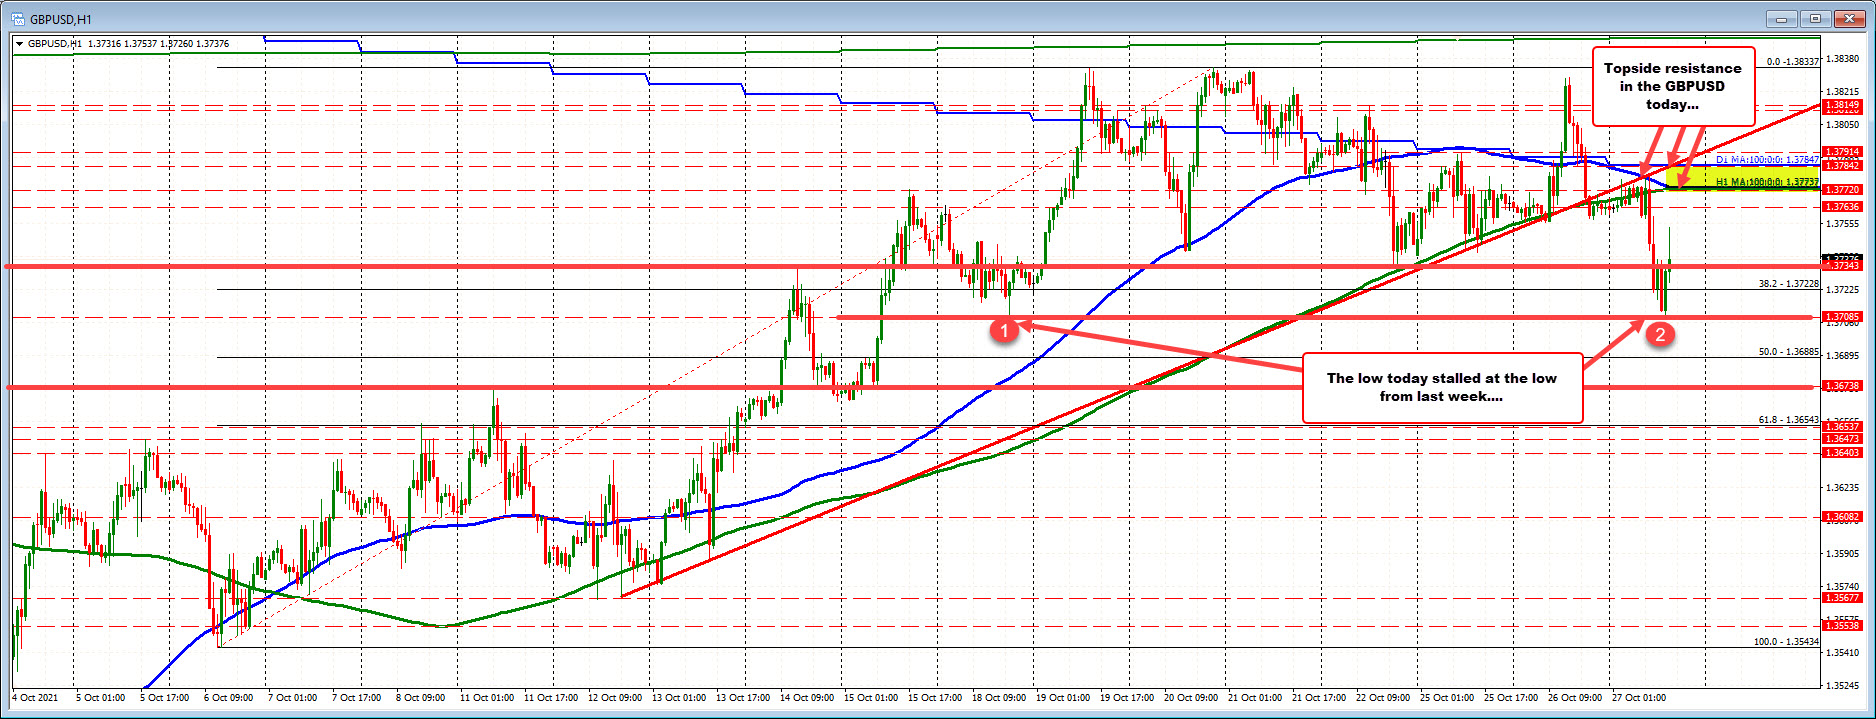
The low today stalled at the low from last week.
The GBPUSD wandered sideways to up in the Asian session and in the process tested a cluster of Moving average resistance between the 200 hour MA and the 100 day MA (currently between 1.3773 and 1.37847. The high price stalled (at the time) against the 100 hour MA at 1.3778. Sellers leaned against it (and the higher 100 day MA at 1.37847) and the price rolled over to the downside.

The run lower in the European session, saw the price fall below the low from Friday at 1.3734, the 38.2% of the move up from the Oct 6 swing low at 1.37228, but stalled just ahead of the swing low from October 18 at 1.37085 (the low for the day reached 1.37119).
The price has bounced and currently trades above the swing low from October 22 at 1.37343 (last Friday). The high on the bounce reached 1.37537.
The pair is lower on the day (bearish). The high stalled in the moving average cluster above (bearish). The low equaled the low from last week (buyers) but failed on the break of the 38.2% of the move higher from October 6. The low also was ahead of the 50%.
The tilt is more to the downside with the 1.37343, and the low from last week at 1.37085 the next targets.
Traders looking for a rebound would like to see the 1.3734 hold intraday. A move below the 38.2% would be more bearish.

October 28, 2021 at 01:02AM
Greg Michalowski
https://ift.tt/3mjzlQg

0 Comments:
Post a Comment
Subscribe to Post Comments [Atom]
<< Home