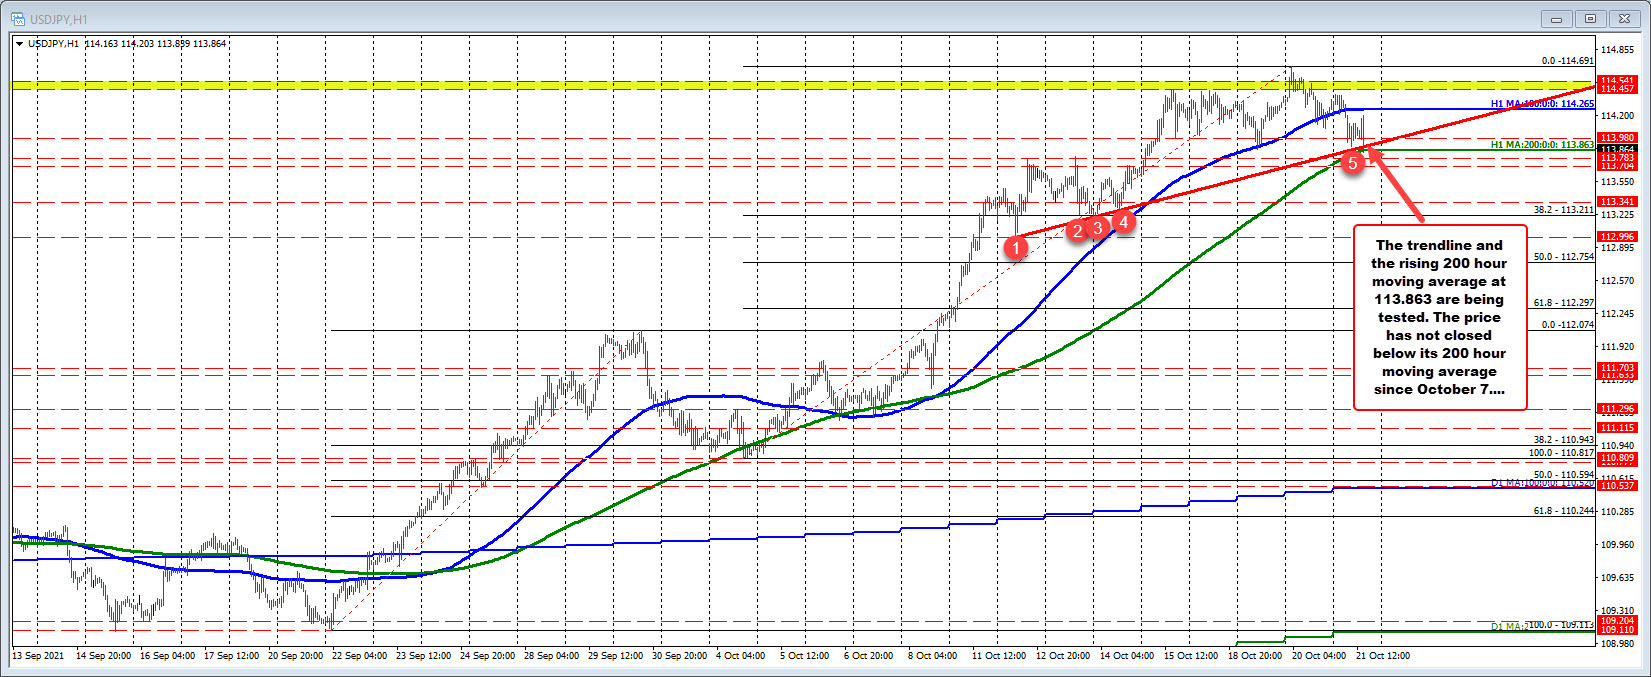
USDJPY trades between its 100 and 200 hour moving averages
Price action continues to consolidate near the highest levels since 2017/2018
The USDJPY it is lower on the day despite the rise in yields. US stocks and global stocks are modestly lower and traders seem to be taking a break from the run higher in the JPY currency pairs (lower JPY).
Looking at the hourly chart, the high price today stalled ahead of the swing highs from last week at 114.457. The pair broke below its 100 hour moving average (blue line currently at 114.265) and continued down toward support at the lower trend line and the rising 200 hour moving average at 113.863. As I type that moving averages being tested. The price is not traded below it since October 7.
Taking a broader look at the weekly chart below, the price high from yesterday's trade reached 114.691. That was just below the swing high from November 2017 at 114.726.
The subsequent move to the downside seen yesterday and into today has now taken the price below the November 2018 swing high at 114.202. The holding of that area is a negative for the price action. Traders with a bias to the downside, would want to see the price stay below the 114.20 level going forward.

October 22, 2021 at 12:56AM
https://ift.tt/2ZaThvY

0 Comments:
Post a Comment
Subscribe to Post Comments [Atom]
<< Home